Block Watne takes CRM, digitalization and business analytics to new heights

“The way people find, view, evaluate and purchase homes has changed because of digitalization, apps and mobile services,” says Bjørnar Tretterud, Sales and Marketing Director at Block Watne, one of Norway’s leading developers of residential properties.

“Customers expect more of us and we must be certain we can deliver to the highest standards. We are continually adapting and refining the way we do things. Buying a new home is a big event in life. We want it to be a fantastic experience.”

Processes and technologies are continuously refined to support the customer journey.

Technologies and workflows that create value

During the past 3 years, Block Watne sales and marketing has put additional focus on technologies and workflows that create value for customers, contractors, suppliers and their business.

The CRM (Customer Relationship Management) system is the central business system for capturing every detail about customers, properties and projects. Without a well-functioning CRM, it isn’t possible to manage the large and intricate process of selling and building more than 1000 new homes each year.

But it isn’t only the CRM system that is important. The data within the system feeds an entire ecosystem of related processes and workflows.

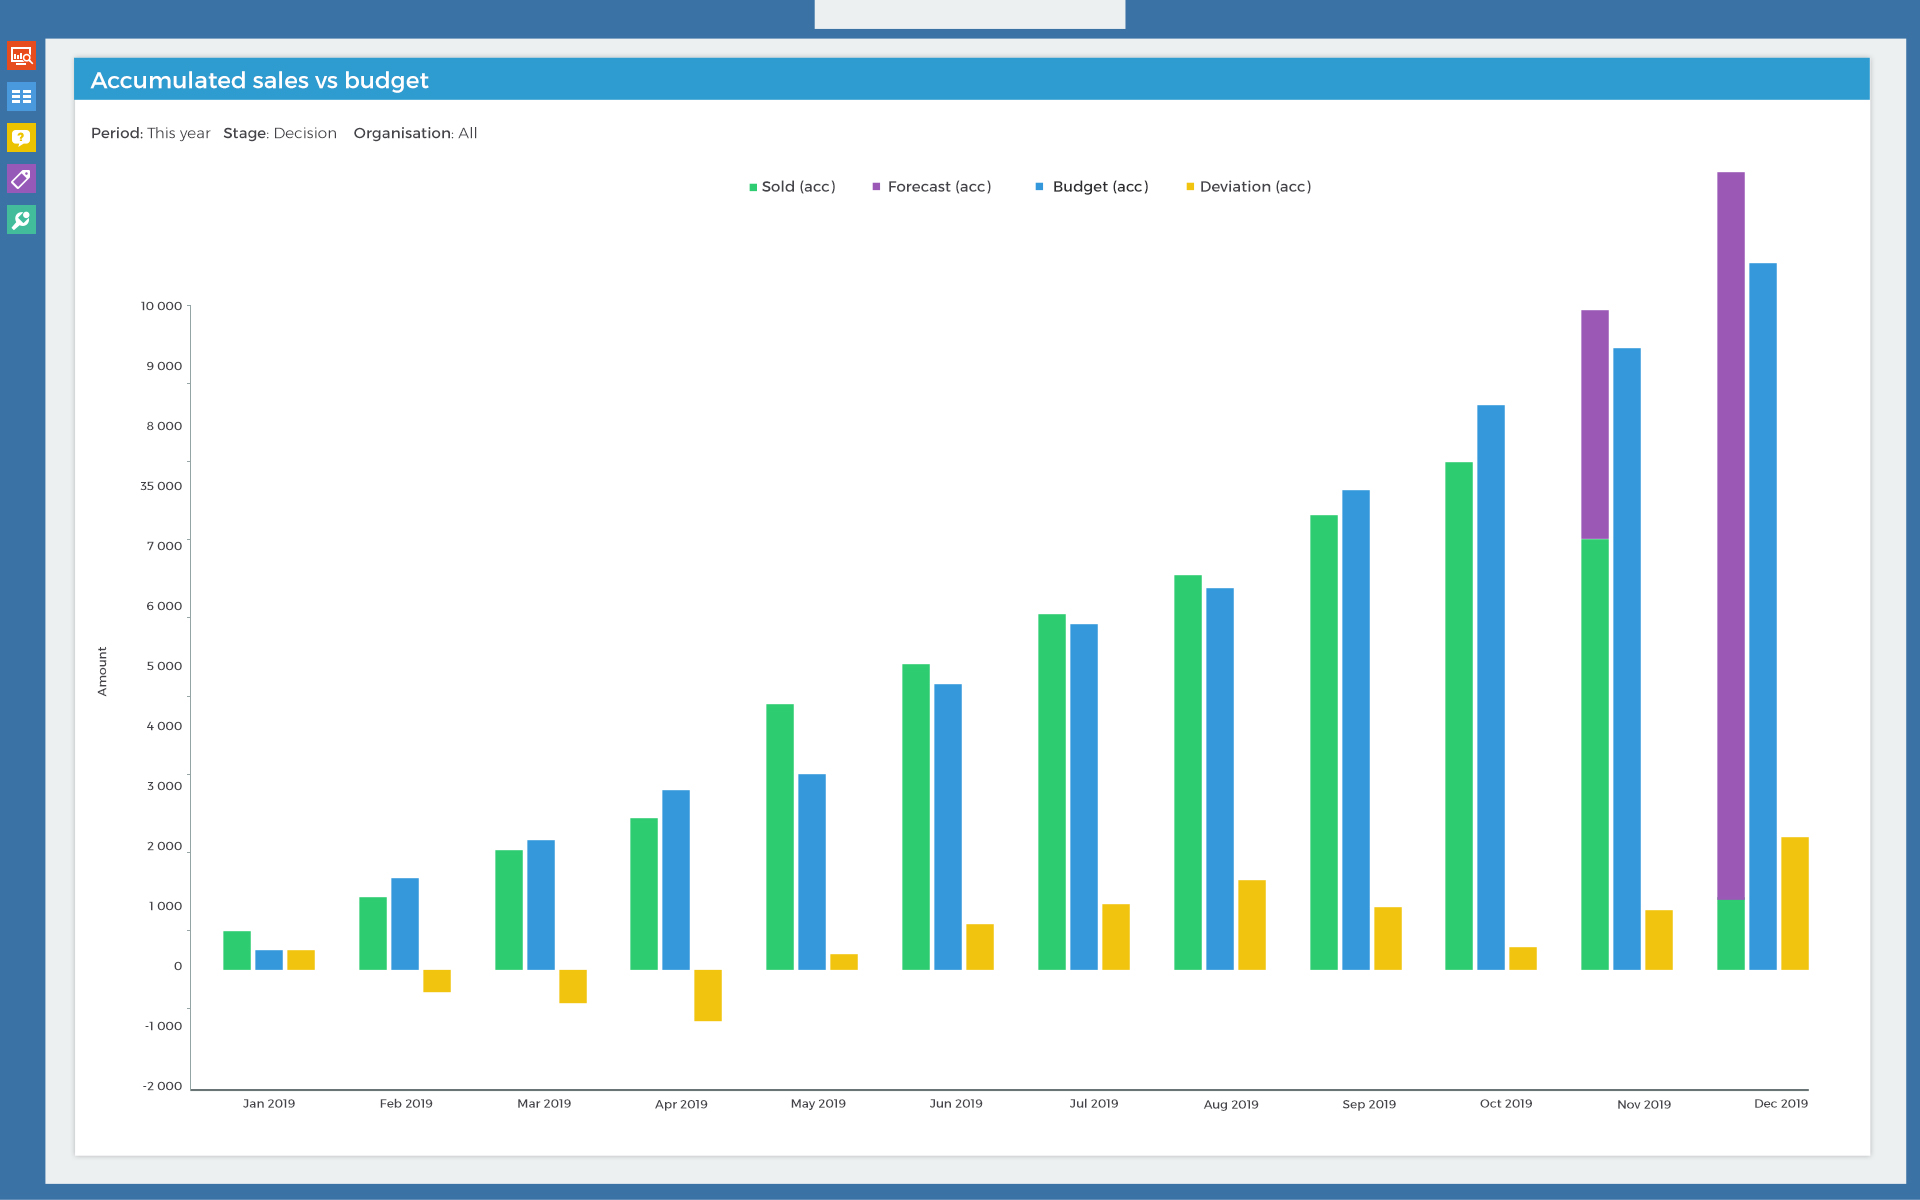
One of these is business analytics. Using business analytics software, Block Watne pulls data from the CRM system, calculates key performance figures, and presents information on digital dashboards so employees have it as needed.

Key outcomes include:

  • Automated sales reporting saving 20 – 30 hours per week among sales directors
  • Improved sales forecasting accuracy to within 98% every month
  • Business analytics for customer service  – average claim handling time reduced from approx. 120 to 50 days
  • Digital dashboards with continuously updated sales figures and stats

Company goals and performance updates are shared from business analytics software to various digital channels.

Rock solid control of sales and forecast to 98% accuracy

More than 230 people in production, sales and marketing uses CRM, analytics and dashboards to carry out tasks and make decisions.

Marketing sees when properties are coming for sale so they can time advertising campaigns.

Sales sees current and past sales by region, property type, location, price or any other dimension of interest. Are we ahead or behind budget? Directors look at pre-packaged reports during their weekly meetings or during meetings with the board of directors.

“This is a substantial change compared to how things were done before dashboards,” says Tretterud. “Regional sales directors used to email their pipeline each week. They dialed in by telephone before the weekly meeting. It was a stress to reach the deadline. Now sales status is updated continuously from the CRM to sales dashboards.


On average we save around 20-30 hours each week. Regional directors don’t have to call in anymore. There’s less stress and meetings are more focused. Since we started with business analytics the sales forecast is accurate to 98%.


He admits he is a stickler for structure. Everything sale and detail must be registered.

“Dashboards are the first thing I check in the morning.  I have full view of units that are coming for sale, which one’s are listed and when they are sold.”

60% faster claim handling time in customer service center

Block Watne’s claim handling time is reduced from approximately 120 to 50 days (58%). The improvement came after the company set clear goals for the customer service center and followed-up handling time on dashboards.

Every customer request that comes in by email is recorded and followed up using SuperOffice customer service system. Then, Business Analyze analytics tool presents insights based on customer service data. Which products or places are their issues? Why? With greater insight, managers improve quality and better manage agreements with suppliers or contractors.

Keep an eye on every step of the process

More than 500 data fields keep track each client’s route to a new home, from the time a property is listed through to completion day. If data about a property or sale is missing or wrongly recorded, Block Watne may experience unnecessary delays or errors.

To avoid this problem, an analytics dashboard monitors data quality.  Are the right bits of data in the CRM or is there a problem?  If everything is correct, there is a green light. If not, a red light links to more details and trouble-shooting.

New developments every month

“There is much more we want to do, but we have to prioritize,” says Tretterud. “Right now we are looking at how data can better help customers see the alternatives and opportunities in their new home, from flooring choices to walls and basement to roof.

“We know that waiting for a home to be completed is both exciting and at times nerve-wracking. By using marketing automation tools more effectively, we can keep customers better informed underway.”

“We are designing and programming new features every month in four large digital development projects and – all the new data we collect will be processes and KPIs (key performance indicators) will be presented via SuperOffice to Business Analyze.

Who’s involved?

Above: Listings of Block Watne homes for sale on www.blockwatne.no

Sign up for the latest articles, product news and event invites.

    By providing your email you agree to our Privacy Policy.

    5 Ways to Share Company Goals and Reach them Quicker

    Photo: Example of goals on a business dashboard. Graphics developed in partnership with contenting.no

    Do your employees fully understand company goals and what is expected of them? Do they know how far they’ve come or what actions to take?

    Writing down goals and presenting them at the yearly kick-off or next company-wide meeting is a good start, but don’t stop there. Make goals visible every day.

    Communicate goals clearly and repeat them again. Over communicating is better than under communicating. Because people have so much to do and receive so many messages, it is easy to get distracted.

    Even groups that start out 100% committed to reaching a goal, can lose momentum over time and come up short. Getting to the next level isn’t easy.

    People need to see progress as it happens. When they reach a milestone, they need to enjoy success right then and there.

    Many B2B companies are using tools like CRM systems and business intelligence software and dashboards to help them reach goals. These tools do the work of measuring progress and informing people of events as they happen. This includes:

    • Knowing where you are heading
    • Understanding what you need to do to get there
    • Celebrating with colleagues when you arrive

    The best performing organisations we work with use the following techniques to reach their goals:

    Make goals visible in real-time (or near real time)

    Goals are continuously measured and communicated on dashboards. This applies to ever type of quantifiable goal (as long as you have the underlying data). By using both activity targets and result targets (e.g. volume or revenue) you lead people in the right direction.

    If a goal isn’t followed up, it isn’t worth having. Too many goals is overload.

    Some examples include:

    • Increase number of new customers
    • Increase inbound requests
    • Increase upselling or cross selling
    • Increase sales for a specific segment or product mix
    • Increase margins
    • Increase customer satisfaction
    • Reduce complaints
    • Increase billable hours or utilization (for example services)
    • Increase in specific activity (for example telephone calls out, first meeting, proposals sent etc.)

    Consider whether you want goals presented at the company, group or personal level. Sales targets, for example, are often cascaded to team and individual level. Managers should see totals and a breakdown per person, category or other parameter. If sales has both an overall revenue budget and a budget per product area, both these can be measured.

    Check that each goal has a time horizon. Should you reach it this week, this month or this year? Including a countdown beside the goal, for example, 15 days left, creates a sense of urgency.

    Design dashboards for a good experience

    Good dashboard design helps people see and understand goals without confusion. Radial buttons are an intuitive way to show percent of goal achieved. Set up drill downs so it is possible to identify issues by examining top-level results on a lower level.

    A special designed leaderboard, like “Budget Busters,” is a clever way to recognize sales performance. This can be a simple list on the mangers’ dashboard or a themed dashboard that is shown on office TV monitors.

    At ipvision, a provider of telephone, mobile and network solutions, the sales team sees a clear view of their month to date performance, what is left to deliver and their earnings. “In the first month, we exceeded our targets,” says Thomas Pedersen, Product Manager.

    Review goal performance in weekly and monthly meetings

    Weekly team meetings are the ideal place to discuss goals and what needs to be done to achieve them.

    It may not be appropriate to discuss how any one person is doing, but you can show team goals and use analytic dashboards to find out where there are problems or opportunities.

    When everyone already knows the status before they go into meetings, no time is wasted going through figures. The discussion will hop to next steps or actions needed.

    Share on the company message board

    A simple graph or barometer shared in your company chat tool or team messaging tool, can motivate people to go the extra mile. This is extra important if your teams are on the road, work from home, or are spread across the country.

    Many leaders post short goal-status updates as part of their routine. 

    Example of a goal-status update exported from the business analytics tool and shared to chat app.

    Discuss, adjust and improve

    Once goals are clearly defined and you start tracking progress, you will gain even more insight into what you need to do. There is seldom any one factor, but just increasing focus can bring about some surprising results.

    What are your thoughts? What keeps you motivated?

    Leave a comment or get in touch with one of our experts.

    Sign up for the latest articles, product news and event invites.

      By providing your email you agree to our Privacy Policy.

      The Business Analytics Guide for B2B Organisations

      If you’re curious about business analytics (or Business Intelligence) and wonder how analytics tools can benefit your organisation, you’ve come to the right place.

      This guide provides straightforward, non-technical answers to important questions including:

      • What is business analytics?
      • Why is it used?
      • How do I get started?

      What is business analytics?

      Business analytics is a group of methods and tools used to analyze and visualize data.

      Business analytics tools pull various sources of data, like those stored within CRM, ERP, customer support, project management system or other database, into one place for analysis.

      This saves business users from having to extract and format data into reports before they can use it as part of their daily work.

      Different analysis tools have different levels of sophistication, but the goal of business analytics tools is to present data in a way that is easy to use and understand.

      Business analysis software enable you to sort, group, filter, segment and chart data. It may also include more advanced analysis like statistical modelling, predictive modelling and forecasting. The results are displayed on dashboards.

      Dashboards are useful because they make data easy to access and share.  Dashboards contain lists, charts, graphs and other types of data visualizations.

      Users login to dashboards through a web browser or app.


      Above: Example of a sales dashboard

      One key advantage of dashboards is users can easily navigate multiple hierarchies of data using ‘drill-downs’ and ‘roll-ups.’

      A drill-down refers to the process of viewing data at a level of increased detail, while roll-up refers to the process of viewing data with decreasing detail.

      Why use business analytics?

      In B2B organisations of all sizes, business analytics is used to gain insight and understanding about business. This leads to better decision-making and higher levels of performance.

      As the volume of data within companies grows, more businesses are turning business analytics.

      IDC forecasts double-digit revenue growth through 2022.

      5 reasons to use business analytics

      Business analytic tools provide different information to different parts of the organisation.

      CEOs and management teams, for example, see company-wide data and monitor KPIs (key performance indicators). Departments track the metrics which are important to their success.

      What key company, sales, and support metrics can you track? See examples.

      What are the differences from spreadsheets?

      While spreadsheets are similar to business analytics tools in some ways, they are very different in others.

      Spreadsheets help you analyze data but they aren’t built to gather data or keep it updated.

      Some of the advantages of business analytics compared to spreadsheets include:

      • Always up-to-date – Analytics tools keep dashboards updated as new data is gathered.
      • Easy navigation – Modern, cloud-based dashboards are easy to navigate and can be accessed from any location.
      • Consistency – There is only one version of dashboard reports and less risk of human error.
      • Easy to share – Dashboards provide users with access to relevant information from any device.
      • Secure – Because data is stored in a database and accessed through secure login, business analytics tools secure data in ways that spreadsheets can’t.

      How to get started

      The easiest way to start is to measure and track one or two of your most important company targets.

      You will be able to see day to day progress and you can keep your organization updated and motivated without paperwork or administration.

      Here are a few tips:

      1. Select your most important goals or KPIs. e.g. 20% revenue growth
      2. Connect to data.
      3. Visualize and share progress to keep focus
      4. Use dashboards and scoreboards to motivate

      You can add more information and do deeper analysis as you go.

      Once you get used to having insights at your fingertips, you won’t be able to manage without.


      Sign up for the latest articles, product news and event invites.

        By providing your email you agree to our Privacy Policy.

        How to increase marketing and sales success with analytic dashboards

        According to Aberdeen Group, organizations with strong marketing and sales alignment increase organization quote attainment at a 97% higher rate, year over year. The conclusion of their research is that organisations with alignment are ‘just plain better’.

        Alignment can mean many things, but at its root, the objective is to ensure sales and marketing are working towards clear, common overall goals.

        And here lies a source of friction. While both teams share common goals at the company level, their KPI ‘s are usually quite different.

        Another source of friction is marketing may not be clearly able to see their contribution to sales, and vice versa. Leads are routed to salespeople, and marketing doesn’t have visibility into what happens after that.

        Even in small tightly knit teams there can be misunderstandings about the handoffs and workflows between sales and marketing.  Are leads being handed off at the right time? Did sales followed up in the best way?

        The more technologies and systems that are used to generate and convert prospects to customers, the more room for error. A prospect can slip through the gaps leading one team to blame the other.

        What is the solution? How can you help your marketing and sales work perfectly in synch? How can everyone gain visibility into goals and work together to reach them?

        There’s one specific tool we recommend. It’s called the lead management dashboard.

        Let’s take a look at why it is so effective.

        Why the lead management dashboard?

        A lead management dashboard breaks barriers and unites the goals of two different groups. The dashboard is the glue between sales and marketing.

        • It clearly shows specific targets and progress towards overall goals
        • It defines the exact meeting point between the two functions on their way to a common goal
        • It doesn’t leave room for misunderstanding because it contains facts about how each team is helping the other based on real data
        • It is practical, easy to implement, and makes non-quantifiable initiatives like improving sales-marketing communications – quantifiable

        Bond building experiences around goals

        The dashboard is the hand-off where marketing says ‘Hi, this person is ready to hear from you!” and sales says “Great, I will follow up!”

        For marketing, every qualified lead is automatically added to the dashboard – according to your company’s own definition of qualified. You can have one or several lead categories. The most important leads for this dashboard are are ‘hot’ leads that deserve prompt follow up by sales.

        Once added to the dashboard, marketing can follow leads as they move from stage to stage. Has initial contact been done? Did it result in a sale? How much was it worth?

        After working so hard to get leads, it is thrilling to see how they develop, and then celebrate the win with sales colleagues. Talk about bonding!

        From the sales side, the contribution of marketing is clear. How many leads have we received? How many  were we able to close? How much effort was required? The dashboard is a great way to build team spirit.

        Avoid confusion

        As salespeople often have long to-do-lists and too little time, a lead management dashboard makes it easier to prioritize efforts.

        When following up a hot lead is one of many tasks on the to-do-list, it may not get the attention it deserves – or it can get accidently overlooked.

        Dashboards keep leads top of mind. Depending on your business, this can translate into big value.

        Has marketing a monthly goal for the number of ‘hot’ leads? Add the goal to the dashboards and send sales a notification every time a hot lead comes in.

        If you normally celebrate a sale, consider also celebrating a hot lead. Both functions benefits from joint responsibility that leads to joint achievement.

        Real-life example

        We recently created our own lead dashboard for a specific marketing activity. Every time someone filled in a request form, the form generated a support ticket in SuperOffce.

        The dashboard shows tickets coming in and the total number of tickets generated versus goals. A column for status, showed where tickets are in the follow-up process and who ‘owns’ the request.

        We can also track how fast leads move from phase to phase or alert someone if follow-up doesn’t happen as quickly as agreed. For example, initial contact within 3 hours after request has been submitted.

        Because several systems and people are working together to attract and respond to requests, it’s reassuring to see on dashboards that every piece is working as it should. It’s also easier to fix errors if it isn’t.

        Improved strategy and conversions

        Once you have started using dashboards, expect healthy discussions about how leads are captured, qualified and followed up. Differences in opinion about what happens at various stages in the marketing-sales funnel, will come to light. They will also be easier to sort out because discussions are based on hard facts, rather than emotions.

        When teams learn more about each other and their customers, they are better able to deliver quality buyer and customer experiences.

        We’d love to hear your experience managing marketing and sales. Leave a comment.

        To set up your lead dashboard, contact us.


        Sign up for the latest articles, product news and event invites.

          By providing your email you agree to our Privacy Policy.

          Big jump for cloud-based business analytics and dashboards. More than 50 new B2B companies turning raw data into instant insight.

          During 2017, more than 50 business-to-business (B2B) companies in Northern Europe started using Business Analyze’s cloud-based business analytics and dashboard solution to analyze data, visualise performance and automate management reporting.

          Turning point for B2B organisations

          “Business analytics has traditionally been associated with large organisations and large amounts data –  so called ‘Big Data’ – but this isn’t the case anymore. 2017 was a turning point,” says Einar Gynnild, CEO at Business Analyze. “All size organisations, large and small, have access to increasing amounts of data from many sources which they can actively use to increase revenues.”

          In 2017, Business Analyze welcomed new customers from a wide range of industries. These include Leca International, Kaffebryggeriet, Stampen, Skarpnes, GET, and Efa Elektro to name a few. The total number of customers using on-premise or cloud analytics is more than 400.

          “B2B companies are adapting their business models, creating smoother customer experiences and automating sales processes – all the while gathering more data. Analyzing growing amounts of data with spreadsheets becomes too slow and inefficient. To get fast insight, business analytics is the natural and necessary next step,” says Gynnild.

          Business Analyze expects demand  to continue in 2018 as leaders and managers use data to improve and execute their strategies, make informed decisions and create competitive advantages. While the digital environment is growing in complexity, the tools to analyze data are becoming simpler.

          This growth also shows customers like Business Analyze’s shift to providing business analytics as a cloud service. The cloud platform enables, amongst other advantages, SuperOffice customers to automatically connect their data and access reports – in a single, straightforward process.

          See also these customer insights

          Visma – Visma is using business analytics to improve support and provide ongoing customer value.

          “We must have complete control of what is happening at every given time. A good CRM system with analytics and dashboards is essential. We record everything the same way every time, follow clear processes and use the most modern cloud-based technologies available.” Julie Grønlund, Director for Visma Customer Care and Activation

          House of Control – SaaS provider House of Control monitors performance and analyzes customer data.

          “At our stage of growth we need to closely managed and monitor the portfolio to ensure good investments. The more data we can use and analyze, the better our decisions.” Carl Fabian Flaaten, CFO at House of Control.

          Tinde – The Norwegian builders of dream cabins, have been through an incredible growth spurt.

          “We simply couldn’t manage using the old methods of spreadsheets. CRM software combined with business analytics keeps us closer to what is important and we move faster.” Audun Skattebo, CEO at Tinde.

          For more information contact us .

          Media contact: Cynthia Kristensen tel: +47 90754435


          Sign up for the latest articles, product news and event invites.

            By providing your email you agree to our Privacy Policy.